Reduced decision making time from 3 weeks
to 3 minutes for a CPG client
What was the problem
The Market Strategy and Sales team aims to manage a successful product portfolio—both
financially and in terms of brand image. To do this, they need to spot performance issues
early, stay ahead of competitors and trends, and maintain strong relationships with retailers
like Amazon.
However, their current tools and workflow make this difficult. They struggle with delayed
decision-making due to scattered dashboards, unclear data visualizations, and inefficient
processes that limit their ability to act quickly.
Their current solution lacked insights, storytelling and actionability.

What did I do
Research – Conducted 10 users interviews and synthesized findings along with one
other researcher
Strategy – Developed robust use cases and built a roadmap to prioritise use cases that
aligns with both business and user needs
UX Design – Dashboard narrative (what data and insights help tell the best story)+
Wireframing and prototyping
Usability Testing – Led pilot testing with champion users
Redefined Information architecture to help build business narratives.
Designed visualizations that drive business insights.
Crafted visual design that evokes a sense of belonging
Check out the full design here!
What was the impact
Users now had all the information they needed at one place - not dumped but carefully
curated to drive actions. This led to reducing the decision making time by 2 weeks
"I'm living in the future", is what one of the users said
The users were thrilled to see visualizations that allowed them to explore data at various levels and derive insights more efficiently. They appreciated how the dashboard not only consolidated information from multiple sources but also helped them tell compelling narratives to their leaders.
Market Strategy Team
"I am ready to say goodbye to fragmented data. Visually these graphs are some of the most aesthetically pleasing I have ever seen"
Sales Account Manager
"I'm living in the future"
With defined design goals, I tweaked our design process - Double Diamond, but
nuanced to an analytical project
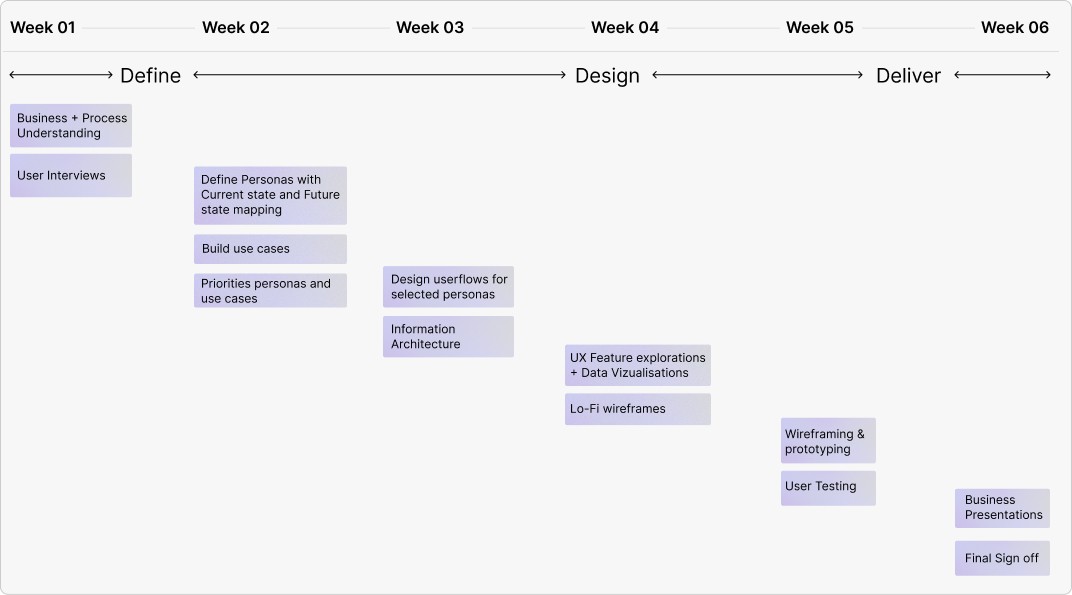
The entire project had a 6 week timeline so it was important to execute on this project in agile.
3 weeks (sprint 01) - requirement gathering & research
2 weeks (sprint 02) - design and development
1 week (sprint 03) - final presentations and sign offs
How might we help the Market Strategy and Sales team make faster,
data-driven decisions by unifying insights,
improving data visualizations, and streamlining workflows?
Business Context was important to
get the requirements right. First few calls were dedicated to gather just that!
I gathered business needs from 2 key business stakeholders and translated them to design goals.
Market strategy and Sales teams in the e-commerce division of a leading CPG(Consumer Packaged Goods) company used tools that lacked insights to answer questions such as these below
> What category of products needs innovation?
> What is driving poor performance of a product?
Translating business goals to design goals

Business Goals
maintain a successful product portfolio,
maintain better retailer relationships
plan long term strategies (improve market share consistently).

Design Goals
Enable users to build a narrative with a holistic view of their portfolio
What? what is the problem
Why? why is it a problem
How? how to fix it
Enable users to visualize data across different levels
Synthesizing insights from interviews to build robust use cases - when
you are optimizing workflows, users generally have numerous needs. It was
my job to bucket them across needs and wants.
15 interviews
2 business functions -
Sales & Market Strategy
3 levels of users - VP,
Manager, Analyst
2 researchers including me
Product Strategy - Use Case Driven
Brilliant Basics
Bringing the relevant data
together for the right user
Bread & Butter
Optimizing existing
processes
Best Bets
Changing the game - build
the dream vision
Breaking Bad
Modifying the business
process
A MS&D manager wants to improve market
share by introducing an innovation/renovation
product for a specific brand to meet
performance targets set at the
beginning of the year.
Profitability at Amazon for a specific cat brand
is not performing as well as the other brands.
A cat lead needs to investigate drivers to
this drop in sell out metrics
For a weekly MS&D clinic meeting, the MS&D
director would want an AI assistant to
generate quick answers for market share
values across markets, categories and
top brands
A MS&D manager wants to build a long-term
strategy for brands and category to stay
competitive and make proactive changes
to the product mix as opposed to
reacting to changes
One of the topline brand is performing poorly
despite successful deployments. The key
account manager would like to assess the
brand across other criteria such as demand,
market share evolution, content,
reviews and ratings.
There is a dip in a category market share
during the 2nd half of the year. A key
account manager needs to investigate why
and identify factors contributing to the drop
in market share and present it in the
Monthly MS&D meetings
A specific cat brand was reported as a
negative contributor for overall sell out
performance after 2 weeks. A key account
manager would like to have intelligence to
action against and expect these changes
prior to improve performance
In order to drive decisions proactively for the
portfolio, the account managers
would like to see projections
for metrics that can influence actions and
for the future, beforehand.
To drive more informed and future looking
decisions, a key account manager would like
to look at ALL products and brands and
not only Top 10 and Bottom 10
A specific cat brand is not growing as fast
as the other brands. A MS&D cat manager
would like to identify the contributors to this
negative growth and action against it
with the retailer
Post prioritizing, we chose the ‘Brilliant Basics’ and a few from ‘Bread & Butter’ to ensure we delivered the most impact in the least amount of time
Unifying insights. Helping users build a narrative.
Three core pillars below to answer the "WHAT", "WHY" and "HOW"

ANALYSE
Have a bird eye view of the entire portfolio
to identify aproblem areas and opportunities
Diagnose a problem area across
different dimensions (holistic view)
INVESTIGATE

Identify key trends in industry
and competition
ANTICIPATE
With the three core pillars, what needs to be looked at high level and what at
granular level was defined with the userflow below


Visualizations help drive decisions. The right ones will help tell the right story.
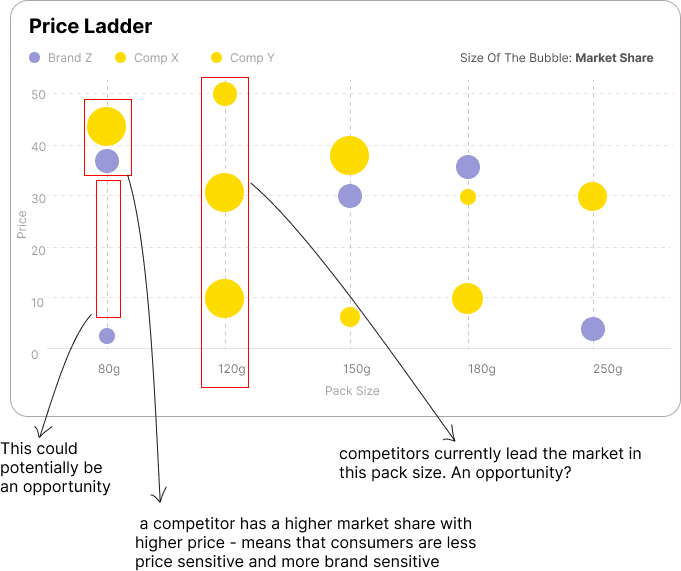
Question a Market Strategy user would like to answer:
Where do opportunities exist in our current portfolio to grow market share—where are we leading, where are we being outpaced, and what untapped areas can we leverage??
How are my current products performing compared to competitors
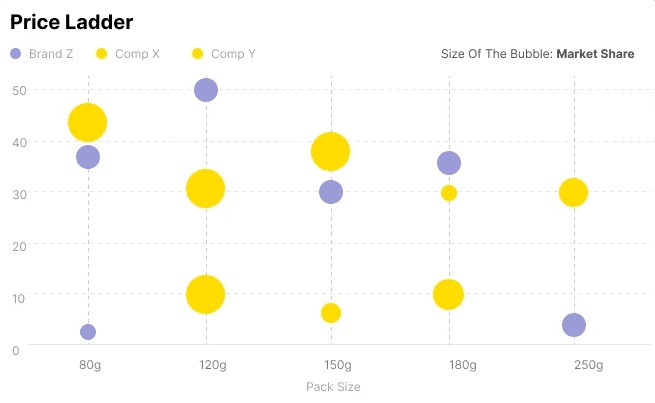
How the user can answer the above questions with this visualisation
As demonstrated on the right image, a market strategy user is trying to understand what price range is optimal to introduce new products (first and third arrow from left shows them what price range and what pack size) and where can they improve revenue (second arrow from left)
The impact? Accelerated decision making. Unified data.
Business storytelling made easy
Let's take an example and find out!
Problem Statement:
Retailer Amazon wants to reduce ‘sell in’, (a metric to define the volume of products Amazon buys
from the manufacturer) for products in Cat-wet-food category. The sales team needs to investigate
why and justify other teams (market strategy, demand planning, supply chain) as to why the sales for the
said category will be low
With their current solution,

Looking at the dashboard above that has a laundry list of metrics, identify the products influencing the overall poor performance of the category, collaborate with Market Strategy team to deep dive further, build storyline and create an action plan in order to improve performance. This process currently takes about 3 weeks to arrive at a decision
With their new solution,
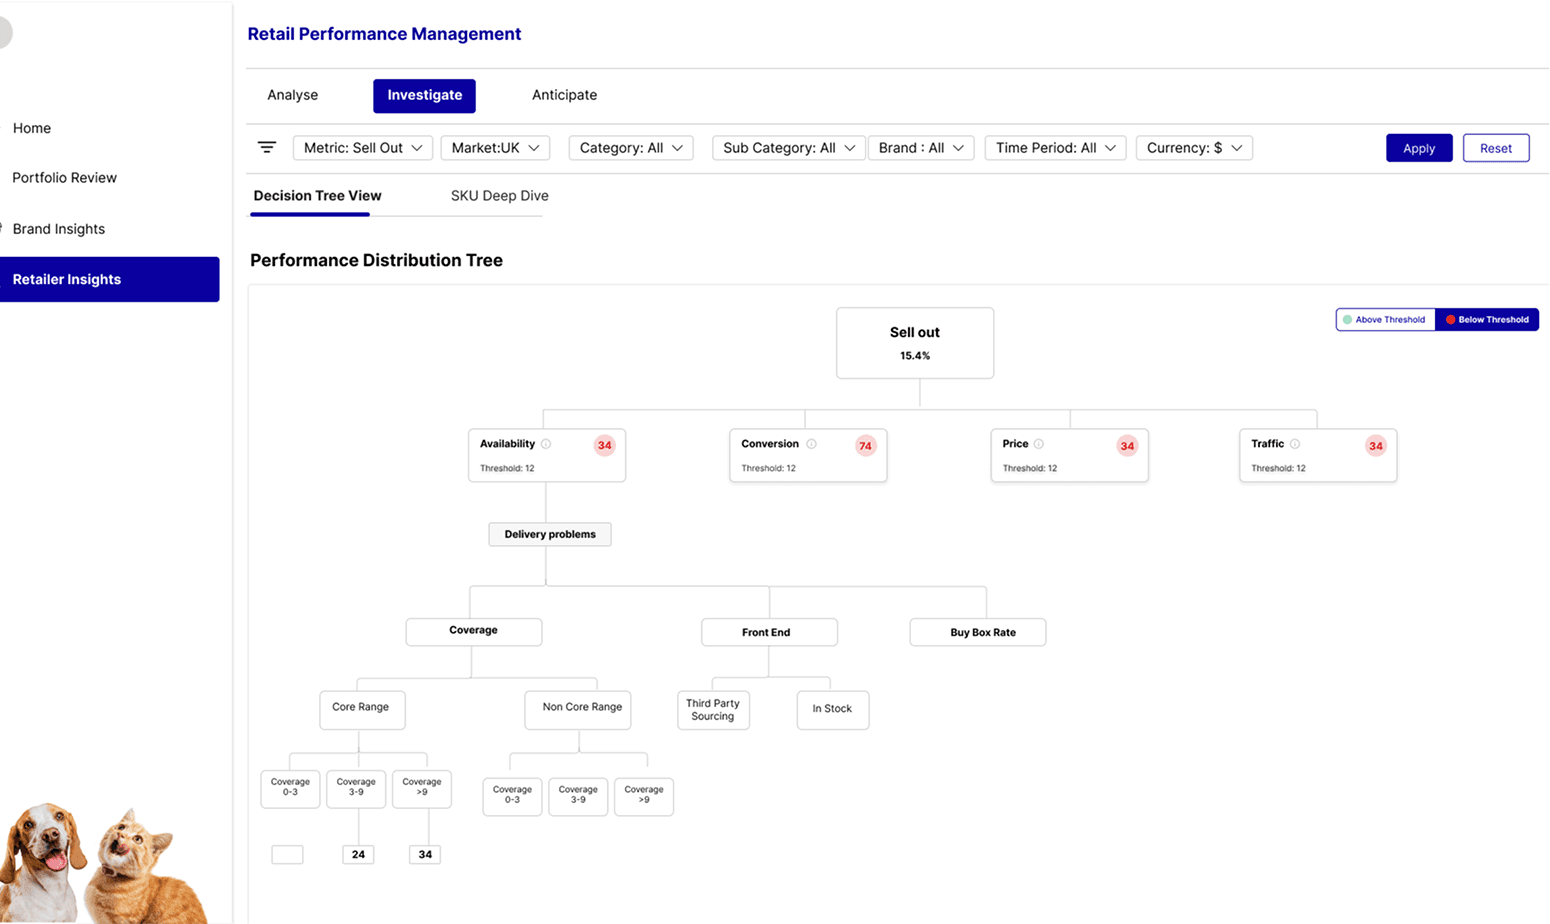
Looking at the tree view in the ‘investigate’ page where all the products are distributed according to their performance across different metrics. The key account manager can click on the metric that is intriguing, analyze further and create action plans- this process would take 2 hours for an expert and 4-5 hours for a novice user.
The entire table is organised in a way to give a bird eye view of the portfolio across metrics. Previously all the analyses were product driven which delayed the decision making process as there were 300+ products. In this version, the view enables analyses to be metric driven which is more actionable.
Redefined Information architecture . Visualizations that drive business insights.
Visual design that alligns with the company branding.